
June Delivers Growth in Sales, Prices and Inventory
June 2025 marked the fifth consecutive month of increased home sales across the 50 metro areas surveyed. Sales activity in June edged up 1.3% from May 2025 and rose 5.7% compared to June of last year.
Inventory continued to grow as well. The number of homes for sale increased 3.9% month over month and rose 30.1% year over year. The Median Sales Price reached $440,000 – up 2.8% over May and 2.1% higher than June 2024.
New listings dipped 12.8% from May – the biggest monthly decline since December’s 24.5% – but finished 1.4% above June 2024. It was the 16th straight month of year-over-year growth in new listings.
“On a national basis, the market continues to be resilient with more homes, more movement, and more opportunity, which is good news,” said RE/MAX Holdings, Inc. CEO Erik Carlson. “Buyers are finding more options, and sellers are seeing demand. This market is giving people the opportunity to make confident moves.”
Chicago had the highest number of sales in June 2025, jumping 12.9% from June 2024. REMAX Premier Broker Mike Opyd said, “Many buyers and sellers in the Chicago market have finally come to terms with today’s housing landscape. This mental shift has allowed more sellers to put their properties on the market and buyers to jump in and try to buy before prices rise farther.”
Other metrics of note:
- Buyers paid an average of 99% of the asking price in June – the same as in May 2025 but below the 100% seen in June 2024.
- Months’ Supply of Inventory rose to 2.7 months, up slightly from the 2.5 in May and higher than the 2.1 months recorded last June.
Highlights and local market results for June include:
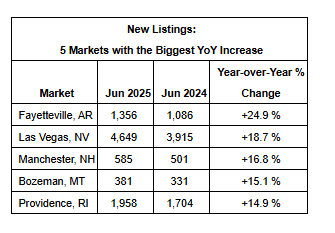
New Listings
In the 50 metro areas surveyed in June 2025, the number of newly listed homes was up 1.4% compared to June 2024, and down 12.8% compared to May 2025. The markets with the biggest increase in year-over-year new listings percentage were Fayetteville, AR at +24.9%, Las Vegas, NV at +18.7%, and Manchester, NH at +16.8%. The markets with the biggest year-over-year decrease in new listings percentage were Trenton, NJ at -25.2%, Philadelphia, PA at -24.0%, and Baltimore, MD at -21.1%.
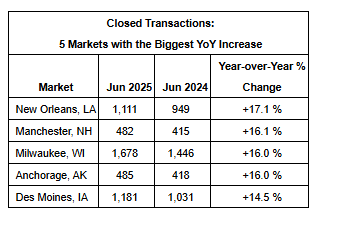
Closed Transactions
Of the 50 metro areas surveyed in June 2025, the overall number of home sales was up 5.7% compared to June 2024, and up 1.3% compared to May 2025. The markets with the biggest increase in year-over-year sales percentages were New Orleans, LA at +17.1%, Manchester, NH at +16.1%, followed by a tie between Anchorage, AK and Milwaukee, WI at +16.0%. The markets with the biggest decrease in year-over-year sales percentage were Miami, FL at -8.4%, Detroit, MI at -7.8%, and Fayetteville, AR at -5.0%.
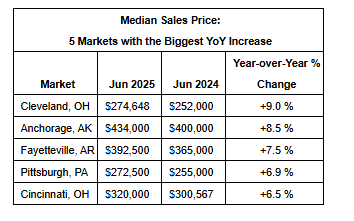
Median Sales Price – Median of 50 metro area prices
In June 2025, the median of all 50 metro area sales prices was $440,000, up 2.1% from June 2024, and up 2.8% compared to May 2025. The markets with the biggest year-over-year increase in median sales price were Cleveland, OH at +9.0%, Anchorage, AK at +8.5%, and Fayetteville, AR at +7.5%. The markets with the biggest year-over-year decrease in median sales price were Bozeman, MT at -7.7%, Tampa, FL at -3.8%, and Atlanta, GA at -3.4%.
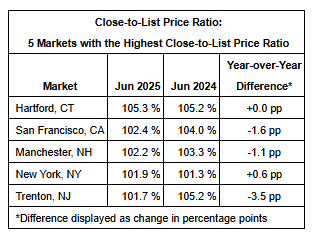
Close-to-List Price Ratio – Average of 50 metro area prices
In June 2025, the average close-to-list price ratio of all 50 metro areas in the report was 99%, down from 100% in June 2024 and the same as May 2025. The close-to-list price ratio is calculated by the average value of the sales price divided by the list price for each transaction. When the number is above 100%, the home closed for more than the list price. If it’s less than 100%, the home sold for less than the list price. The metro areas with the highest close-to-list price ratios were Hartford, CT at 105.3%, San Francisco, CA at 102.4%, and Manchester, NH at 102.2%. The metro areas with the lowest close-to-list price ratio were Miami, FL at 93.7%, Coeur d’Alene, ID at 96.3%, and New Orleans, LA at 96.5%.
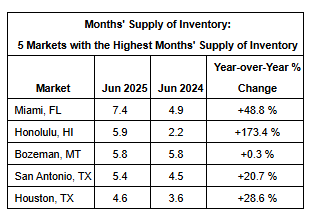
Months’ Supply of Inventory – Average of 50 metro areas
The number of homes for sale in June 2025 was up 30.1% from June 2024, and up 3.9% from May 2025. Based on the rate of home sales in June 2025, the months’ supply of inventory was 2.7, up from 2.1 from June 2024, and up from 2.5 from May 2025. In June 2025, the markets with the highest months’ supply of inventory were Miami, FL at 7.4, Honolulu, HI at 5.9, and Bozeman, MT at 5.8. The markets with the lowest months’ supply of inventory were a tie between Hartford CT and Manchester, NH at 1.0, followed by Milwaukee, WI at 1.1.
Discover the latest trends and insights—explore the Business Insights Journal for up-to-date strategies and industry breakthroughs!